As the learning landscape continues to shift due to hybrid education, new challenges and existing inequities in our education systems have become even more apparent. But despite these challenges, digital learning is here to stay. Experts nationwide say online learning will continue to be a fundamental component of K-12 schooling moving forward.
Why? Research suggests that online learning increases information retention by 25-60%1 and takes students less time to complete than traditional in-classroom instruction. Digital learning can be a valuable tool for delivering instruction when students cannot be physically present in school—such as weather-related school closures. It also supports more personalized learning, with flexibility for learning to take place anywhere, at any time.
The pandemic fast-tracked an already existing need for more robust digital and hybrid learning systems in K-12. In 2019, “the education industry indicated the lowest adoption rate (17%) of data analysis and data-driven features in designing instruction and optimizing learning outcomes.”2 So when 2020 school closures started, relatively few education systems were prepared to address it quickly.
Necessity is the mother of invention, and some changes from the COVID-19 pandemic are likely to stay and deliver positive results. As digital learning becomes a permanent part of K-12 education, analytics that provide educators actionable insights about student access, engagement, and outcomes will be critical to determining the effectiveness of these programs.

Measuring Access
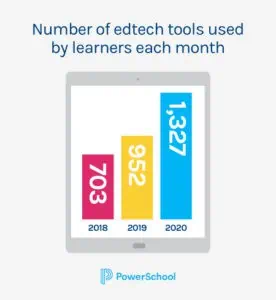
The adoption and use of learning management systems (LMS) and other digital tools increased as districts shifted their learning models throughout the last school year.
But just having these systems in place isn’t enough to ensure learning is happening. Students must be able to access digital resources on the same level they’d get them in an in-person classroom. But up to 60% of disconnected K-12 students, about 9 million students—especially Black and urban students—can’t afford digital access.3

There is an immediate need to measure and track student access to online learning. Without knowing which students can access digital instruction, unfinished learning will continue to worsen. In the 2020-2021 school year, it’s projected that in mathematics, students are on average losing five to nine months of learning. Students that are BIPOC could be as much as six to 12 months behind, compared with four to eight months for white students.

Measuring if students and families can access the LMS or other online learning is the first step in combatting these issues. Seeing if students are logging in and interacting with course content and then monitoring overall trends in student login activity can indicate which student groups lack or struggle with access.

PowerSchool Analytics & Insights translates these kinds of data points from learning management systems like PowerSchool Schoology Learning and other digital tools into easily digestible dashboards. With these dashboards, you can see the number of enrolled students versus the number of logins, the percentage of active or inactive students by school, and the breakout by grade level, subgroups, and days of the week.
Measuring Engagement
Ensuring every child has access to digital learning is the first fundamental challenge, but it’s only the start. For students to learn, they have to be engaged. By refocusing school accountability metrics to capture not just barriers to access and attendance but also barriers to meaningful participation in learning, we can reimagine ways to engage those who are at risk and help them become active agents of their own learning.4

A survey by America’s Promise Alliance during the COVID-19 pandemic showed that “more than three-fourths of 13- to 19-year-olds have been showing up for online classes at least four days a week, but they’re generally spending less time on learning than if they were in school.”5 This shows an immediate need to track student engagement with digital curriculum and instruction. Identifying any learning gaps and developing a complete picture of student performance is necessary to implement a Whole Child Approach to education.
Measuring how students and parents use and interact with LMS content will help inform where potential learning gaps are forming or already exist. This will also help teachers develop new ways to engage learners meaningfully. More personalized instruction can help staff successfully deliver engaging blended learning to students.

Analytics & Insights helps school staff capture a holistic view of each student by combining LMS data with additional student information such as attendance, behavior, academics, and Social and Emotional Learning (SEL) data. Districts can then analyze this data by subgroup disaggregation (e.g., English language learners, students experiencing homelessness) to provide equitable and personalized education to all students.

Howard County, MD
State reports are a limited snapshot of data at one point in time. Analytics & Insights’ capabilities show near real-time data that are valuable to our district.
Brandy Iskin Coordinator of Data Warehouse and Reporting
Howard County Public School System
Measuring Outcomes
Measuring student outcomes is the best way to see if your access and engagement efforts are improving learning gains. Student outcomes will show you how well your digital learning program is accelerating learning gains, or if it isn’t—which is a signal to evaluate access and engagement efforts to find out why.
Real-time student data can help you identify correlations between student outcomes and digital learning access and engagement (for example, if LMS participation rates impact student grades and test scores).

Only by measuring outcomes will you gain a complete view of student performance within digital learning. For educators to be responsive to student needs, they must first understand where students are and then design instruction accordingly.
“[Analytics & Insights] supported leadership and school staff so that they could make sure that students were getting what they needed in a timely manner,” says Brandy Iskin, Coordinator of Data Warehouse and Reporting at Maryland’s Howard County Public School System.
Connecting LMS data with other data sources through Analytics & Insights provides school staff with the knowledge needed to understand digital learning adoption and efficacy, ensure effective learning experiences, and, in turn, improve student outcomes.

By having the building blocks of measuring access, engagement, and outcomes in place, schools and districts are better prepared to minimize the impact of future disruptions and continue to deliver high–quality personalized instruction no matter where students are in their learning journey.

Insights Report: The Evolving Role of Education Data
Learn five key data trends that can help guide more flexible, inclusive, and equitable education environments for all students.
Get Your Copy